Nonlinear Curve Fit
Advertisement
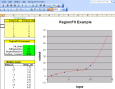
MagicPlot Student v.2.3
MagicPlot is an easy to use program for scientific and engineering data analysis, graphing and nonlinear curve fitting. MagicPlot provides publication-quality graphs. It is fast, lightweight and does not need installation.
Advertisement

Visual Fitting v.2.5.0
Math tool for linear, nonlinear curve fitting and surface fitting, curve and surface can be created.
CHEMIX School v.4.00
CHEMIX School - Software for Chemistry It is equipped with a periodic table, molecular 3-D viewer, curve fit, spectroscopy, conversion table, dictionary and many advanced graphic tools and calculators. Chemistry lessons and problems are included.
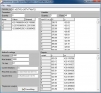
Nonlinear regression - CurveFitter v.4.5.61
CurveFitter performs statistical regression analysis to estimate the values of parameters for linear, multivariate, polynomial, exponential and nonlinear functions.
DataFitting v.1.7.22
DataFitting is a powerful statistical analysis program that performs linear and nonlinear regression analysis (i.e. curve fitting).
Regression Analysis - CurveFitter v.4.5.6
CurveFitter program performs statistical regression analysis to estimate the values of parameters for linear, multivariate, polynomial, exponential and nonlinear functions.
CurveFitter v.4.5.22
CurveFitter performs statistical regression analysis to estimate the values of parameters for linear, multivariate, polynomial, exponential and nonlinear functions.
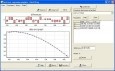
Fityk v.0.9.8
Fityk is user friendly, open source software for nonlinear curve fitting and data analysis.
Sicyon Lite
Sicyon = expression (VBScript/JScript) calculator + constant database + units converter + solver + curve-fit
MathGrapher v.2.0
Mathgrapher is a mathematical graphing tool for 2D and 3D functions and data. The mathematical graphing tool for students, scientists and engineers. Draw and analyse Functions and Data in 2D and 3D. Draw surface graphs,
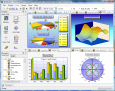
DataScene
DataScene is a data graphing, animation, and analysis software package. It allows the user to easily plot 2D & 3D graphs with scientific, financial, and statistical data, to manipulate, print, and export high quality graphs, to analyze data with various